Behavior-based safety: How to reduce construction incidents
Blog
Safety

A contractor just missed out on a $28 million job they should’ve won because of a single safety number above the project owner’s prequalification limit. Leadership now demands that the operations lead explain why the incident rate exceeded the threshold.
That number represents a lagging indicator. It records past performance, and no team can change it. Teams can change the work that precedes incidents, which is what safety leading indicators measure. Careful tracking catches risks early enough to avert accidents, improving workplace safety and lowering incident rates.
This article covers the difference between leading and lagging indicators, explores actionable leading indicators examples worth tracking, and explains how to apply them across every job.
Predictive leading indicators keep tabs on the work that prevents incidents. Lagging indicators tally the ones that slip through. Here’s a breakdown of each.
A leading indicator is a predictive measure that tracks proactive safety management. It focuses on the work crews perform before an accident happens. Teams measure metrics like completed hazard inspections, reported hazards, and held toolbox talks week to week. When these metrics move in the wrong direction, warning signs reveal which jobsites need immediate attention while teams still have time to fix the underlying safety issues.
Some leading indicators shows up as a behavioral pattern across crews. For example, a batch of fall-protection harnesses arrives with worn stitching. Three out of four crews flag the worn gear and refuse to clip in, but the fourth crew stays silent. That gap is the signal: The same defective equipment likely reached all four groups, yet only three took action.
Lagging indicators measure past performance such as Occupational Safety and Health Administration (OSHA) recordable injuries, lost-time cases, and workers’ comp claims.
The total recordable incident rate (TRIR) tracks how often those injuries happen per hours worked. The days away, restricted, or transferred (DART) rate the cases serious enough to pull someone off the job, restrict their duties, or move them to different work. And the experience modification rate (EMR) turns those past claims into a cost multiplier for insurance premiums. None of these metrics provide advanced warning.
If a worker falls while wearing a compromised harness, the resulting injury record marks a failure of the leading indicators. Either nobody flagged the faulty gear, or no one tracked the warning signs.
Lagging indicators serve leadership teams and clients by evaluating historical data. Leading indicators track safety management across active jobs in real time. Relying solely on lagging numbers makes risk management purely reactive, while focusing only on leading indicators means tracking preventative efforts without a clear picture of whether they’re actually stopping real-world incidents. When organizations track both types together, their safety programs become more effective. In fact, organizations that rank highest in ABC’s 2026 Health and Safety Performance Report achieve an 85% lower TRIR than the industry average. The takeaway: contractors that pair daily prevention work with historical tracking post far fewer injuries than those that rely on either one alone.
Beyond lower TRIR and DART metrics, tracking leading indicators helps protect:
These seven safety leading indicators examples are the most actionable metrics for measuring whether a safety program actively protects every jobsite.
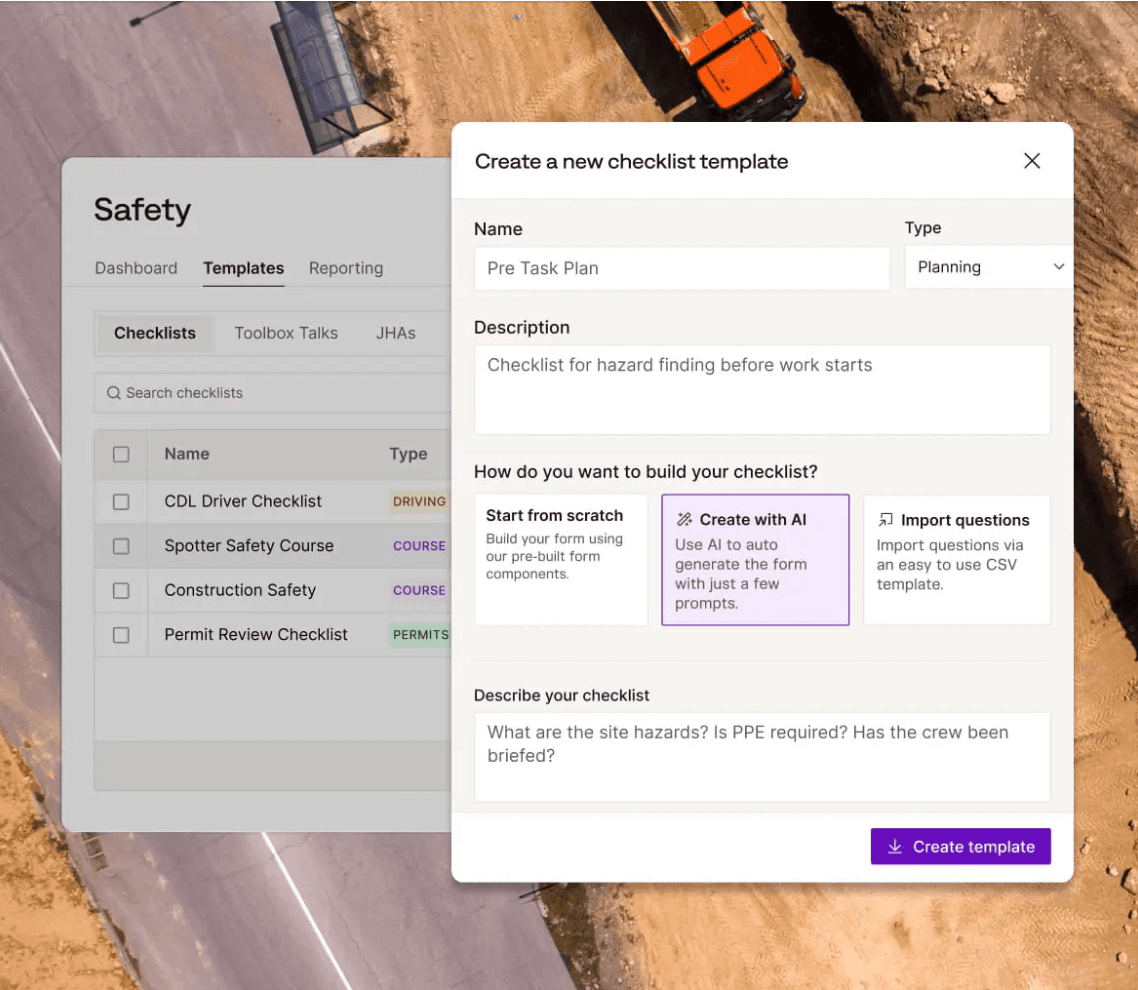
Safety training completion verifies whether every crew member holds the proper qualifications or has completed the required training for assigned tasks. This includes fall protection, forklift operation, and confined space entry. It replaces assumptions about workforce competency with verifiable proof.
Safety managers should track:
A red flag would be safety managers discovering expired or missing certifications on an active jobsite.
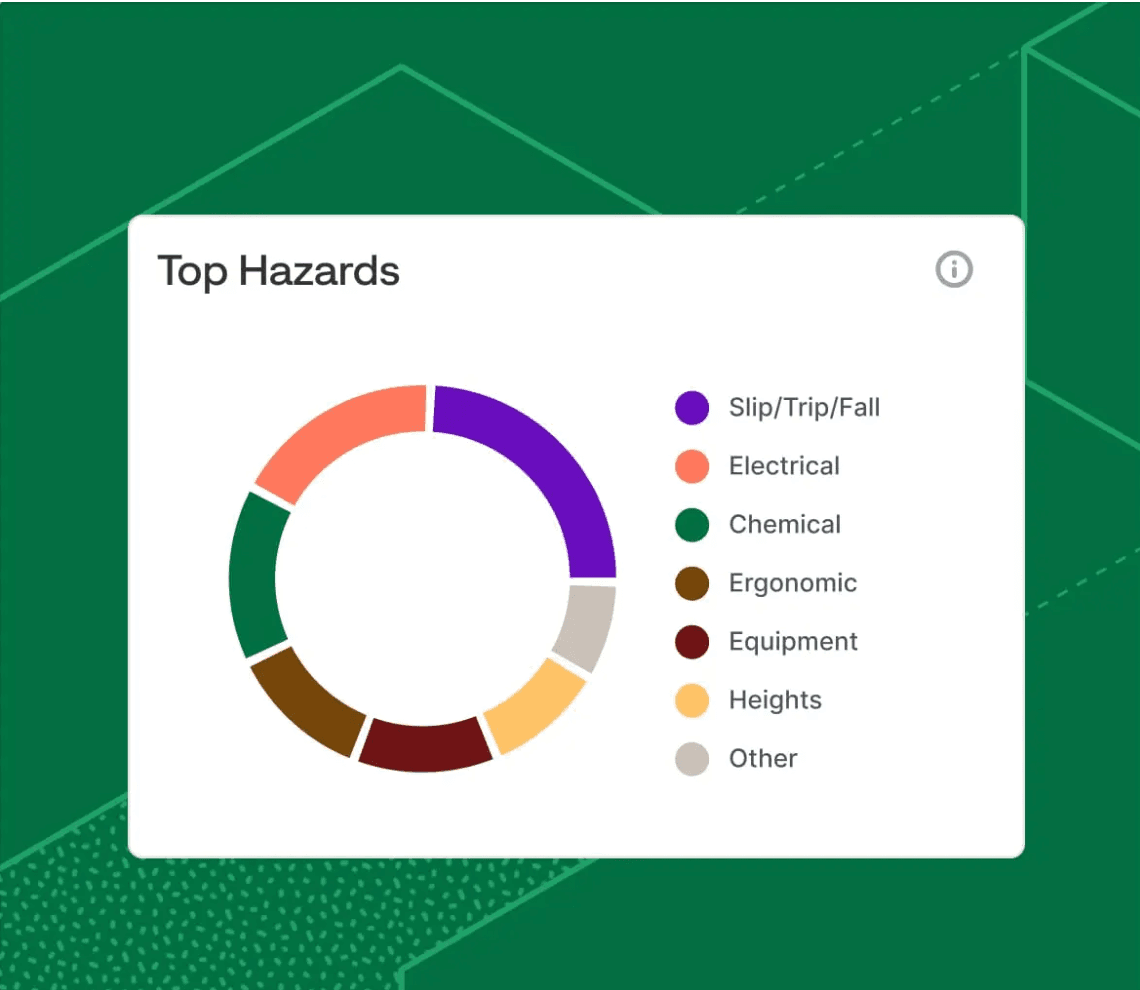
Near-miss reports capture dangerous events that narrowly avoid disaster, like a swinging load missing a worker or someone recovering balance at an unprotected edge. These reports surface root causes so teams can fix hazards before an actual injury occurs.
Site supervisors should track:
A red flag would be reported near-misses resulting in zero corrective actions.
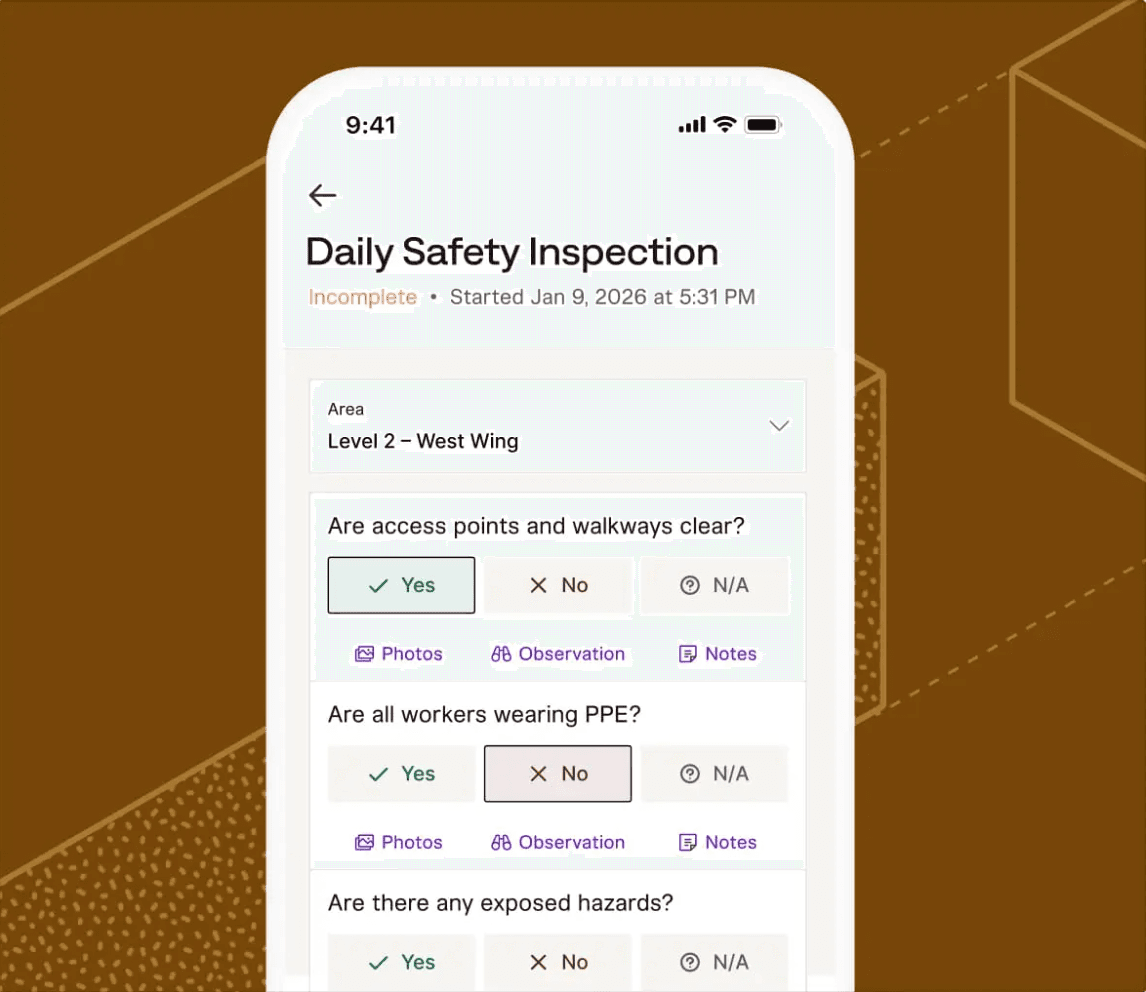
This metric monitors critical physical elements like missing guardrails, frayed electrical cords, and faulty machinery brakes. Maintaining a strict cadence involves pre-use equipment checks before each shift, as well as weekly site walkthroughs and formal monthly or quarterly construction safety audits.
Safety teams should track:
A red flag would be completion rates declining for daily inspections and equipment pre-checks, especially under schedule pressure.
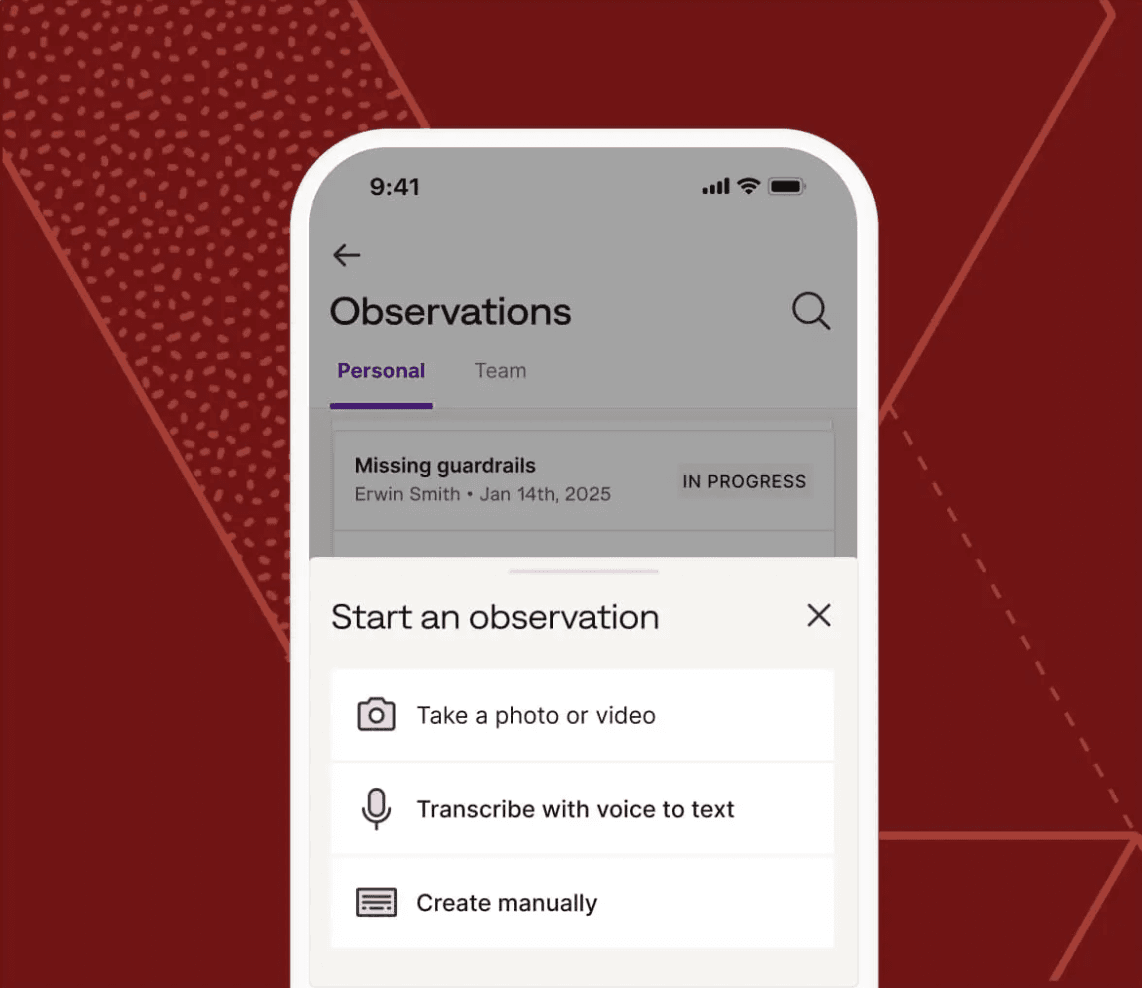
Workers notice everyday behaviors that don’t always make it into a report, like someone reaching dangerously from a ladder or properly rigging a complex lift. Well-designed observation programs capture both safe habits and at-risk practices.
Field leaders should track:
A red flag would be extreme disparities where a few crews report constantly, while others report nothing at all.
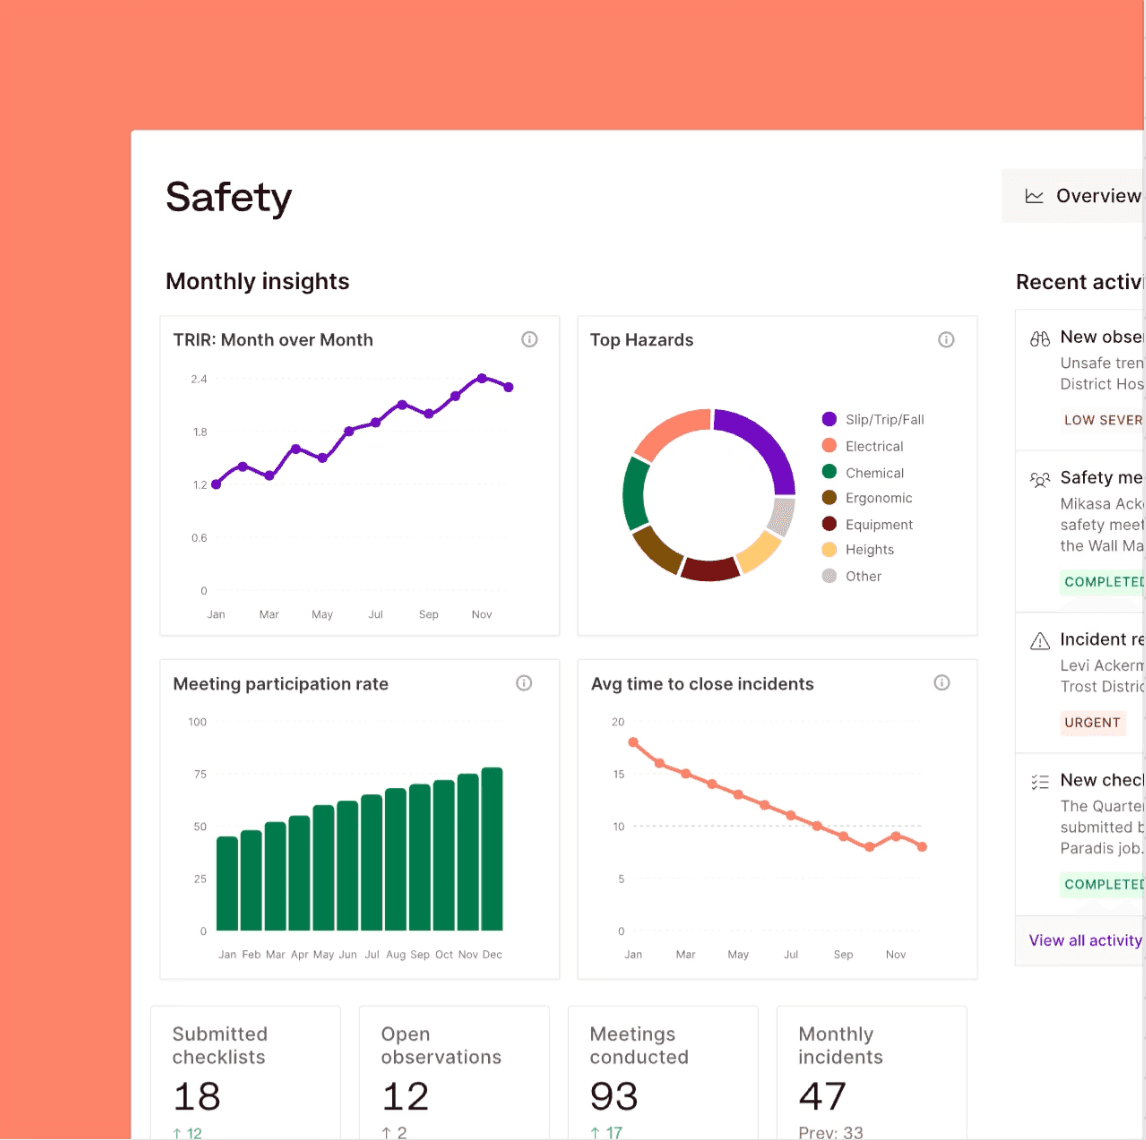
Toolbox talks are short daily or weekly safety huddles run by crews before starting work. Tracking this metric ensures safety discussions actually happen consistently across all active jobs.
Project managers should track:
A red flag would be a healthy company-wide average masking one crew or region that’s barely running talks.
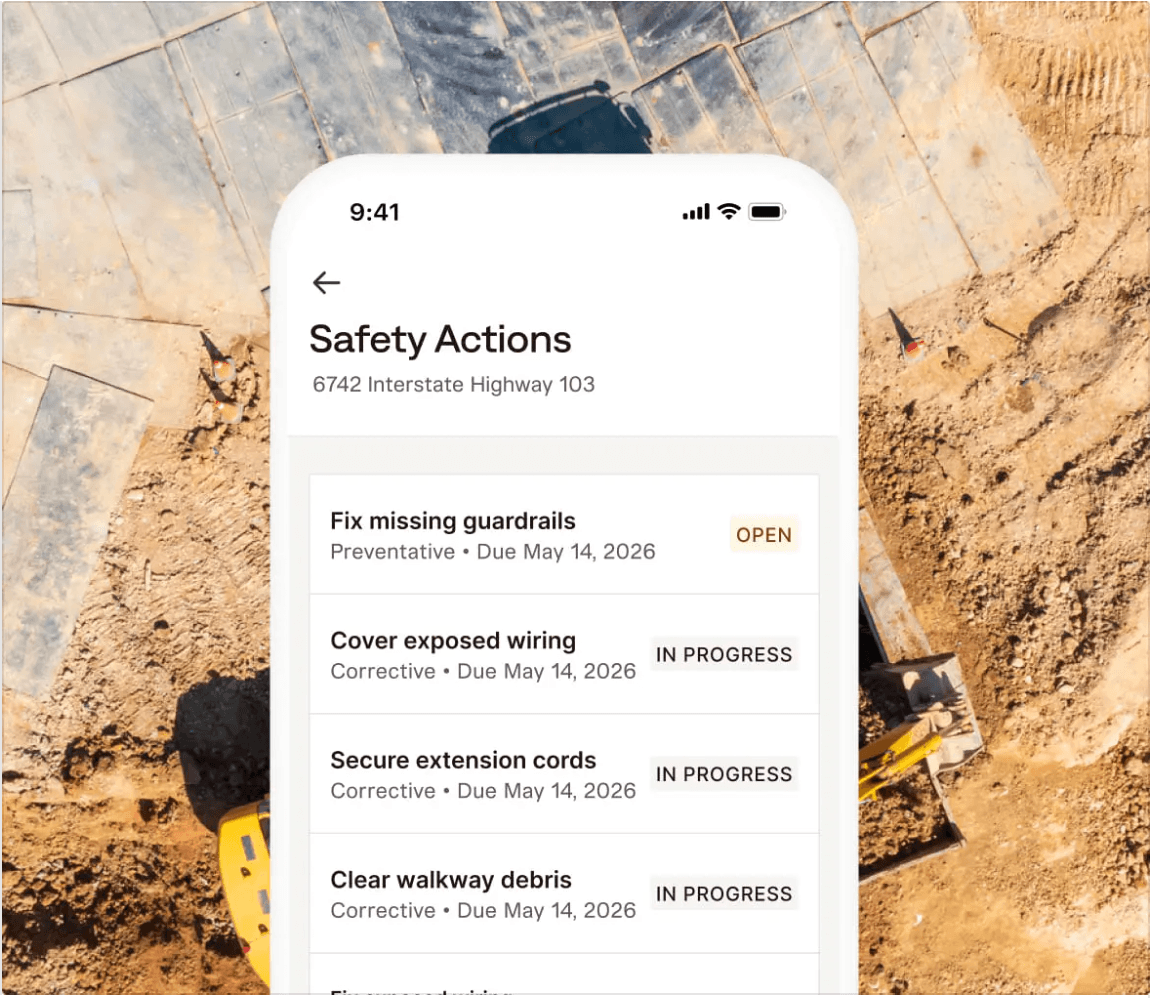
Identifying a hazard means nothing if the team fails to fix it. This metric tracks whether teams actually resolve reported hazards and how quickly action happens.
Operations teams should track:
A red flag would be a growing backlog of open corrective actions.
Before tackling a high-risk task, crews walk through every step, hazard, and control together. This collaborative review is known as a job safety analysis (JSA) or job hazard analysis (JHA).
Work crews should track:
A red flag would be a team marking JSAs as complete even though only a fraction of the crew signed them.
Turning leading indicator metrics into a strong safety program with safer jobs and smoother operations requires deliberate habits.
Run the same core set of metrics on every active project, including small and short jobs. This ensures the numbers line up side by side and outliers appear early. Site-specific safety plans still tailor safety protocols to each job, but the core indicators remain the same across the board.
Visibility drives both awareness and accountability. When supervisors see their own numbers next to other crews’ data, lagging groups may be inspired to catch up quickly. Share these trends with field employees regularly instead of reserving the data exclusively for executives so teams have the opportunity to address discrepancies.
Act on a trend, like a sudden spike in near-misses or unaddressed safety hazards while it’s still developing. Retrain crews on repeating hazards and resolve aging corrective actions before an actual injury occurs. When data serves as a coaching tool rather than a report card, it turns safety metrics into an actionable guide. Focusing on just two or three key factors at a time gives leaders clear, manageable insights to mentor their teams effectively rather than overwhelming them with too much information.
Every practice above builds a safety culture, but all of them depend entirely on crews reporting near misses, hazards, and incidents directly from the jobsite. Field conditions complicate reporting: A superintendent may work two levels below grade with no signal, and a night crew may finish a concrete pour at 4 a.m. when the site office is dark. If logging a hazard requires returning to a trailer computer, workers might not log it. The leading indicators show a clean week that never actually happened, and the real injury shows up later in the lagging indicators.
Health and safety metrics depend on software that matches jobsite conditions. It must be mobile, support one-handed entry, and function offline.
Tracking workplace safety indicators across dozens of active jobs is nearly impossible on spreadsheets, paper forms, and disconnected systems. The data almost always arrives late, if it arrives at all.
Purpose-built safety platforms close that gap. Miter Safety captures meetings, checklists, incidents, and observations in one place. Then, the platform sets leading indicators beside lagging metrics on a single safety overview dashboard. Because Miter Safety runs on the same platform construction companies already use for payroll and field ops, safety data lines up with the jobs and hours behind it. By automatically tying incidents to real-time work hours, leaders get accurate incident rates instantly instead of guessing months later. The platform also pinpoints which crews drive risk, and reporting is fast enough from a phone that crews actually do it.
Greg Sanford, executive vice president at Rubicon Applied Divers (and an early user), highlights visibility as the differentiator. “Miter Safety is awesome. The transparency into TRIR and who signed off on safety meetings is bar none the best.”